

M2 stock list
Marcus Trent, Director of Technical Protocols
What this is
M2 is a monthly list of stocks whose prices are rising, and rising faster. Each month we buy the strongest names and hold them until the next monthly reset. This is the October list, bought on Oct 8 and held until Nov 1. It holds 13 names.
Performance
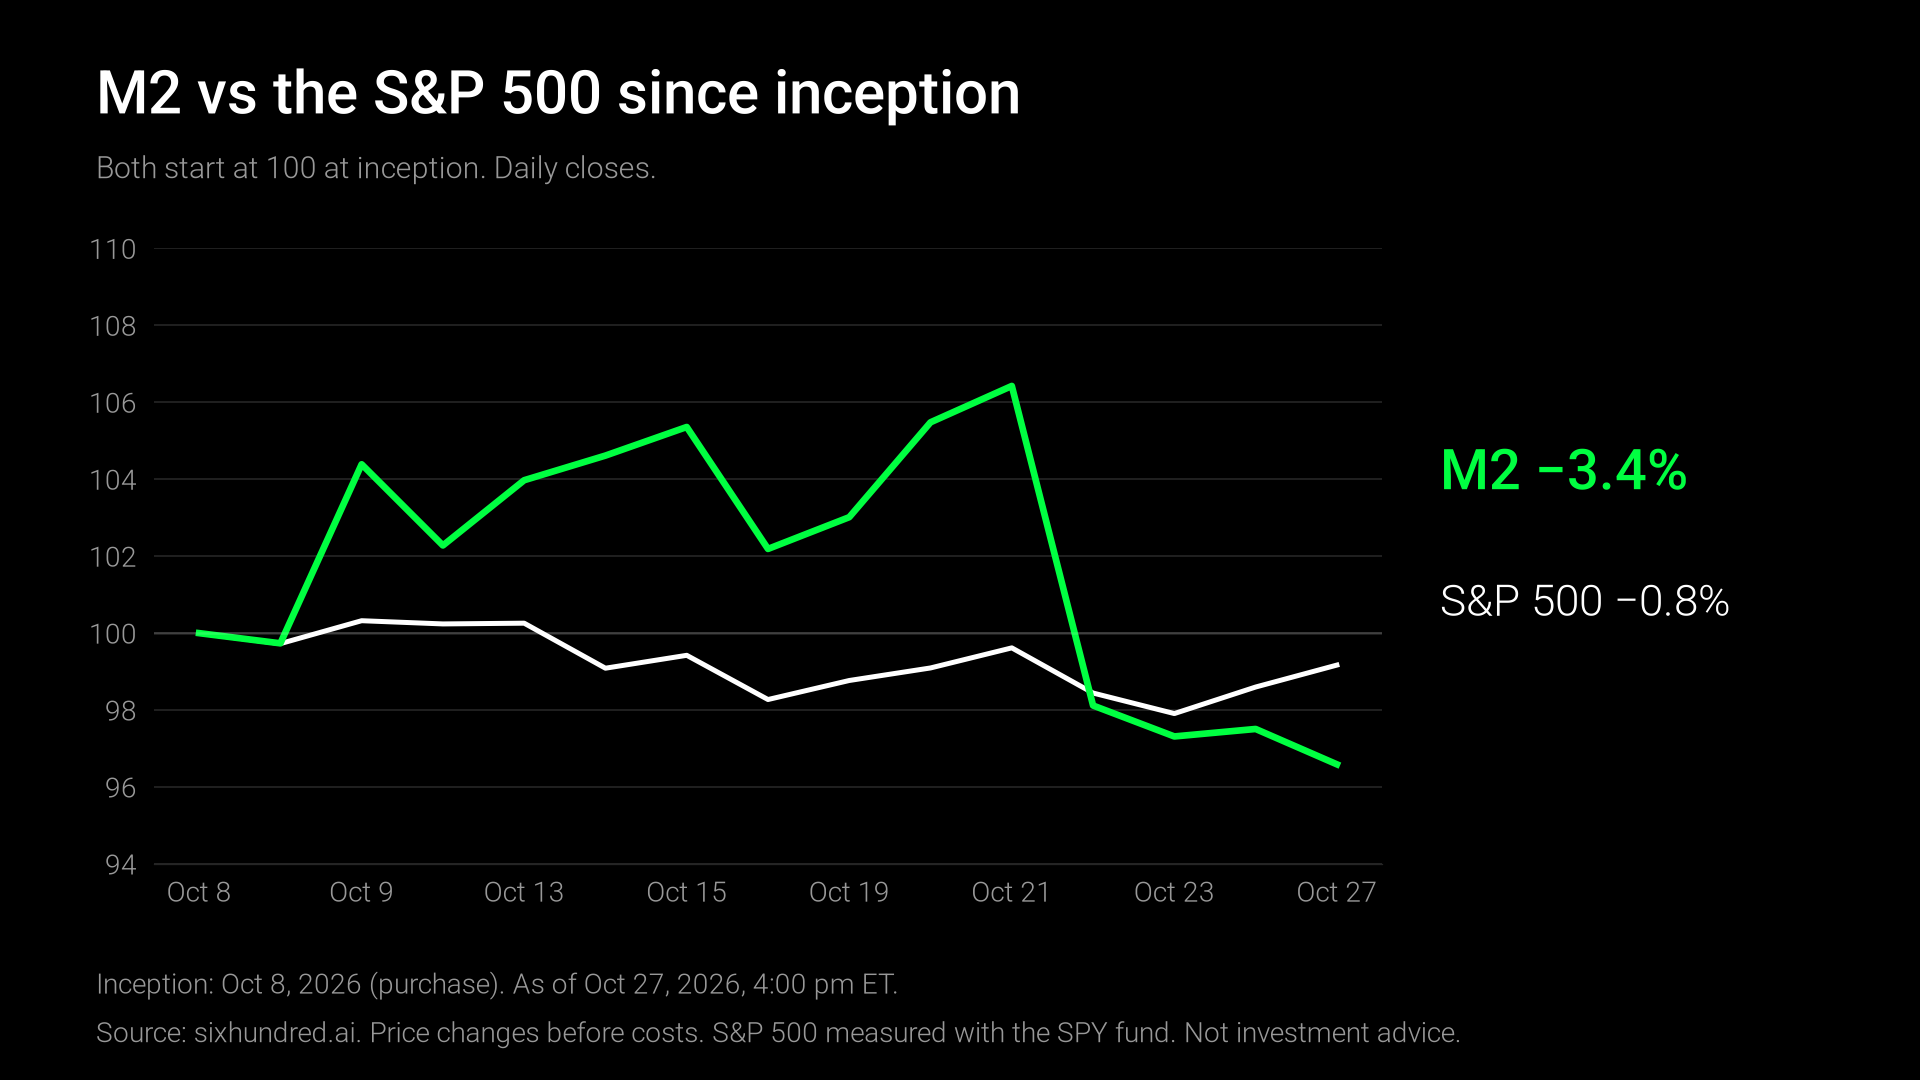
Since inception on Oct 8 the portfolio is −3.4%, against −0.8% for the S&P 500.
- Best so far: APA, APA Corp, +8.1%
- Weakest so far: CEG, Constellation Energy, −15.4%
- Next reset: Nov 1, 2026
Holdings
| Ticker | Company | Allocation | Change since purchase | 1-year return | Off peak close |
|---|---|---|---|---|---|
| APA | APA Corp | 3.1% | +8.1% | +117.6% | −2.1% |
| MRNA | Moderna | 34.5% | +6.3% | +680.1% | −15.5% |
| HCA | HCA Healthcare | 2.8% | +1.8% | −3.8% | −4.4% |
| UHS | Universal Health Services | 3.3% | +1.3% | −17.1% | −5.5% |
| PTC | PTC | 6.0% | +0.4% | −4.3% | 0.0% |
| BITO | ProShares Bitcoin Strategy ETF | 7.9% | −2.3% | −43.0% | −4.5% |
| MPC | Marathon Petroleum | 13.4% | −5.1% | +122.2% | −10.0% |
| WPM | Wheaton Precious Metals | 3.1% | −6.5% | +33.3% | −9.1% |
| COIN | Coinbase | 2.0% | −8.9% | −55.4% | −12.1% |
| VLO | Valero Energy | 14.3% | −11.4% | +122.2% | −15.8% |
| VST | Vistra | 2.7% | −12.2% | −26.4% | −12.2% |
| META | Meta Platforms | 3.8% | −14.3% | −17.4% | −18.7% |
| CEG | Constellation Energy | 3.2% | −15.4% | −33.8% | −15.4% |
| M2 | M2 portfolio | 100.0% | −3.4% | +265.0% | −9.2% |
| SPY | S&P 500 (memo) | – | −0.8% | +12.3% | −1.1% |
Shading: brighter green = larger gain. 1-year: Yahoo Finance; M2 row weighted by current allocation. Not investment advice.
Allocation is each holding's share of the M2 book at current market value, as of Oct 27, 2026, 4:00 pm ET. Off peak close is the gap to the highest close since purchase. The M2 portfolio row's change since purchase is the since-inception figure from the performance chart; its 1-year return is weighted by current allocation.
Notes
- Prices as of Oct 27, 2026, 4:00 pm ET. Returns are price changes from the average purchase price, before trading costs and dividends.
- Holding weights and returns are rounded once, to one decimal.
- The S&P 500 figure uses the price of the SPY fund over the same window.
- This page is a diary of a rules-based method, not investment advice.

In the paper test, M2 returned about 86% a year, and its worst drop from a peak was about 15%. QQQ returned about 27% a year over the same stretch, with a worst drop of about 15%. Past paper results are not a promise.
The rules, in English. Score a name by its last four months, plus whether that move is still speeding up versus two months ago. Hold the strongest names that are still speeding up. Cap any one name at 30% of the portfolio. Sell if a name falls 25% from its high since we bought it. New list at the end of each month.