

How we read the trend in bitcoin, QQQ and gold
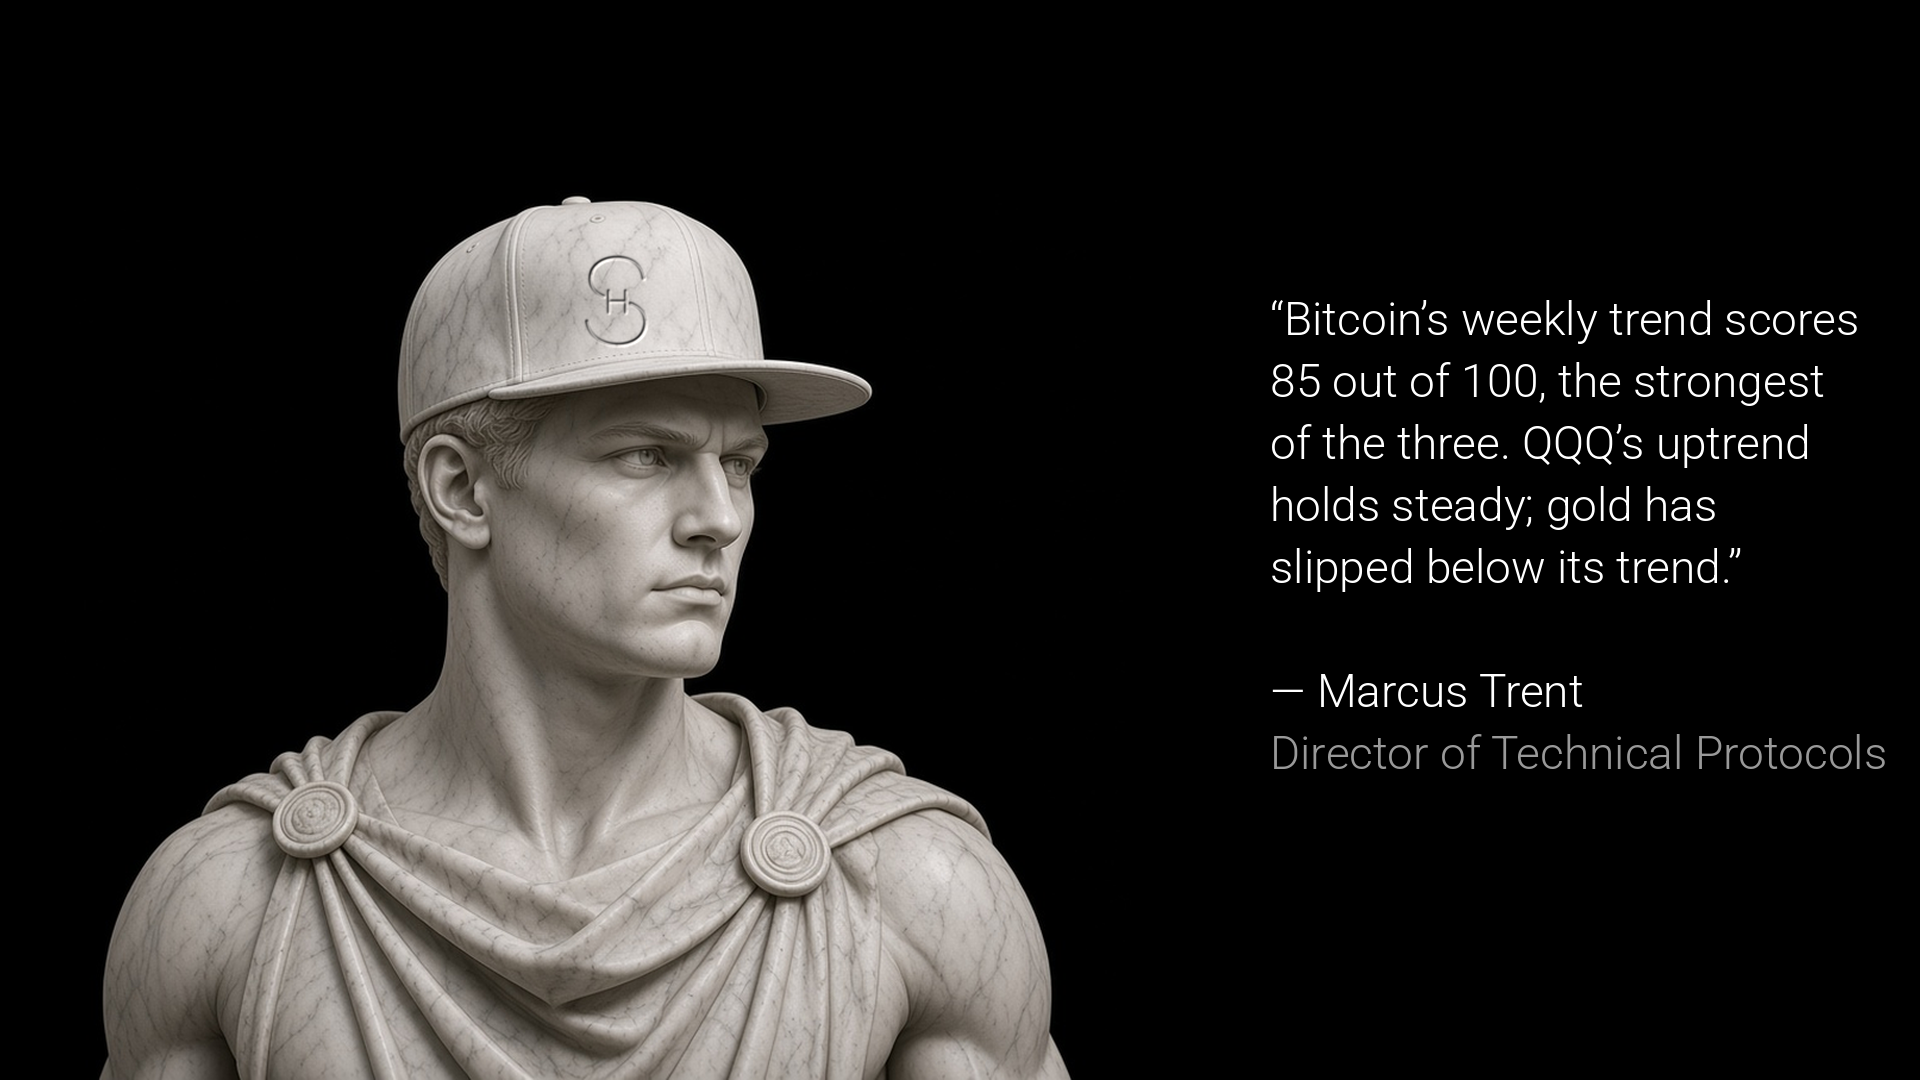
Marcus Trent, Director of Technical Protocols
Sixhundred looks at three long-term assets through one simple weekly lens: bitcoin, the Nasdaq-100 fund QQQ, and gold. Each gets a conviction score from 0 to 100, rebuilt from weekly closes. It is a way of reading trends, not a trading signal.
The scores this week
| Asset | Score | Trend (of 40) | Momentum (of 25) | Open pattern (of 35) |
|---|---|---|---|---|
| Bitcoin (BTC) | 85 | 40 | 25 | 20.0 |
| Invesco QQQ (QQQ) | 65 | 40 | 25 | 0 |
| SPDR Gold Shares (GLD) | 20 | 10 | 10 | 0 |
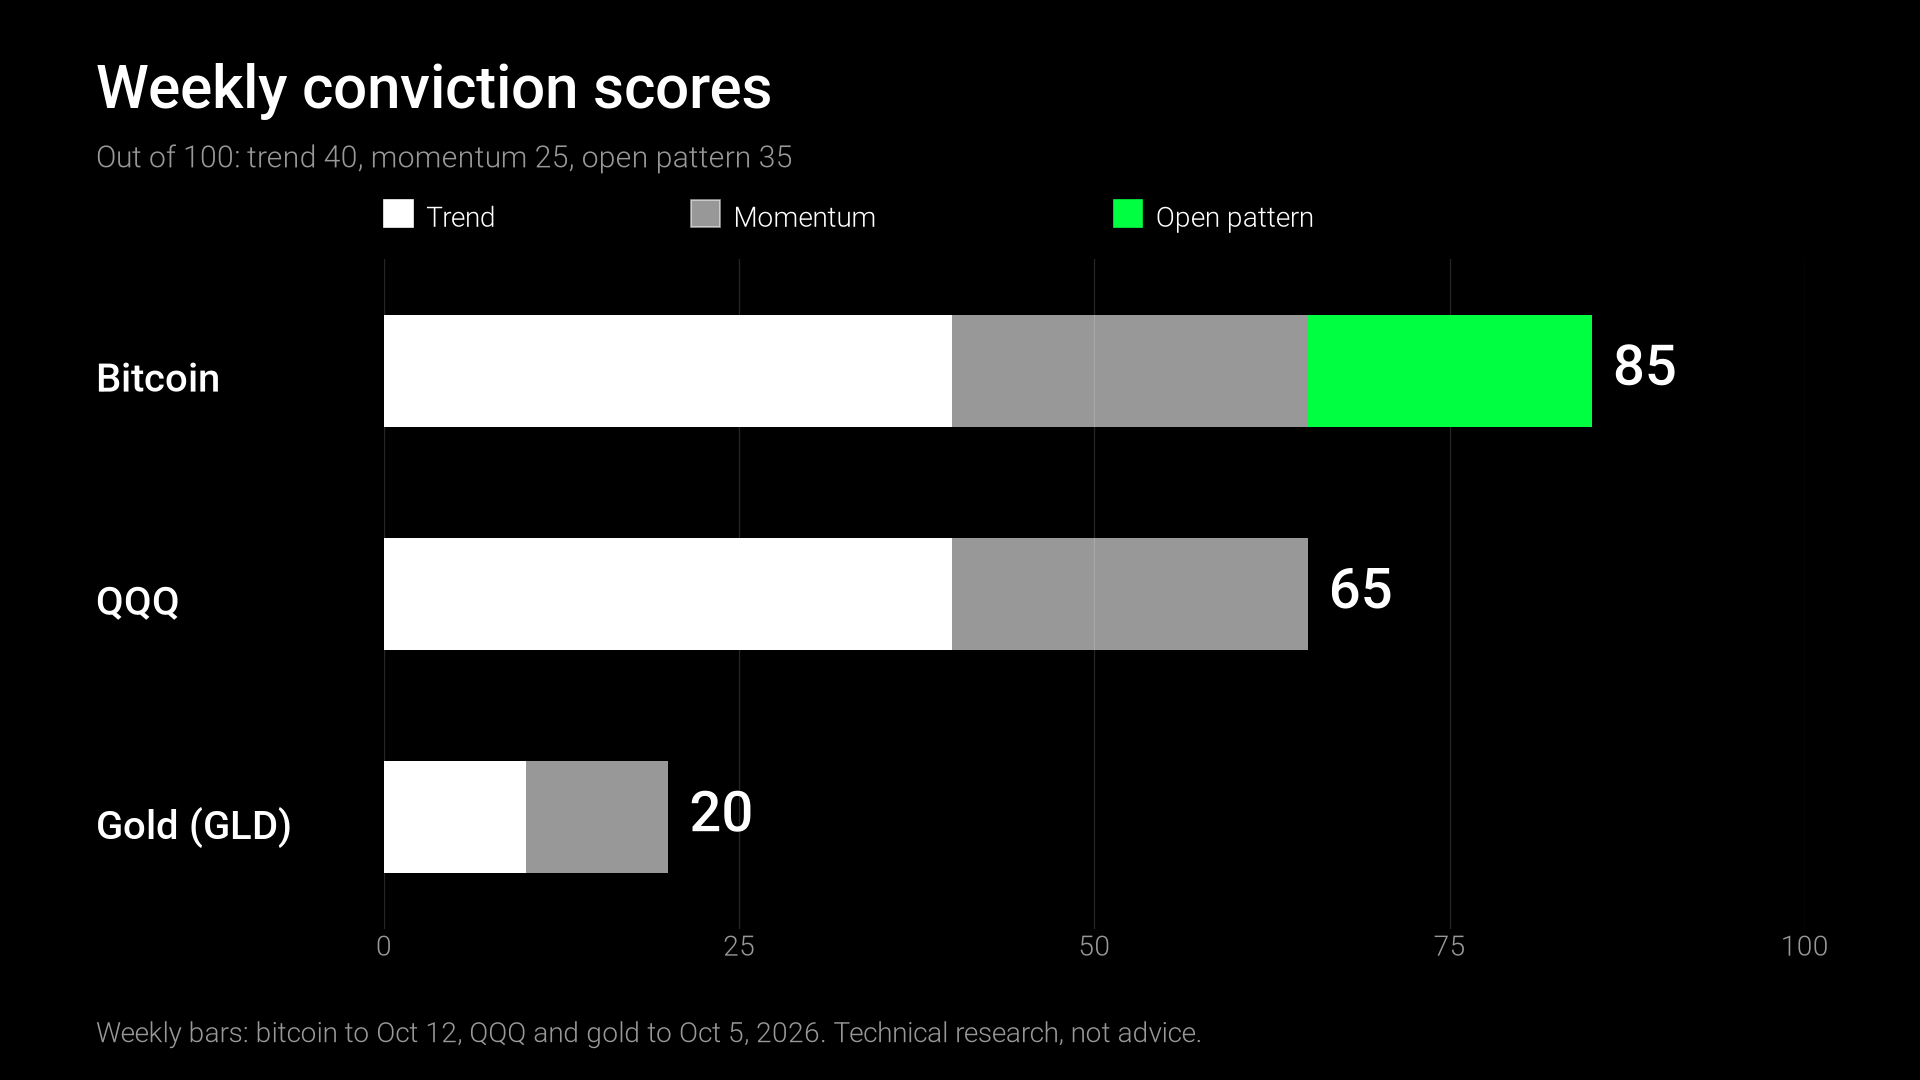
Bitcoin leads. Every trend and momentum check passes, and a pattern with a solid record is live. QQQ's trend is just as clean, but no pattern is open right now. Gold has lost its trend for the moment.
How the score works
Three blocks, all from weekly closes:
- Trend, 40 points. 10 each for: the close is above the 20-week exponential moving average (EMA); that EMA is above the 40-week average; the EMA is higher than four weeks ago; the close is above the 200-week average.
- Momentum, 25 points. 10 if weekly MACD is above its signal line, 5 if MACD is above zero, 10 if the 13-week return is positive.
- Open pattern, 35 points. If one of six classic weekly chart patterns is live, the asset earns 35 times that pattern's shrunk win rate. If more than one is live, the better one counts. No live pattern, no points.
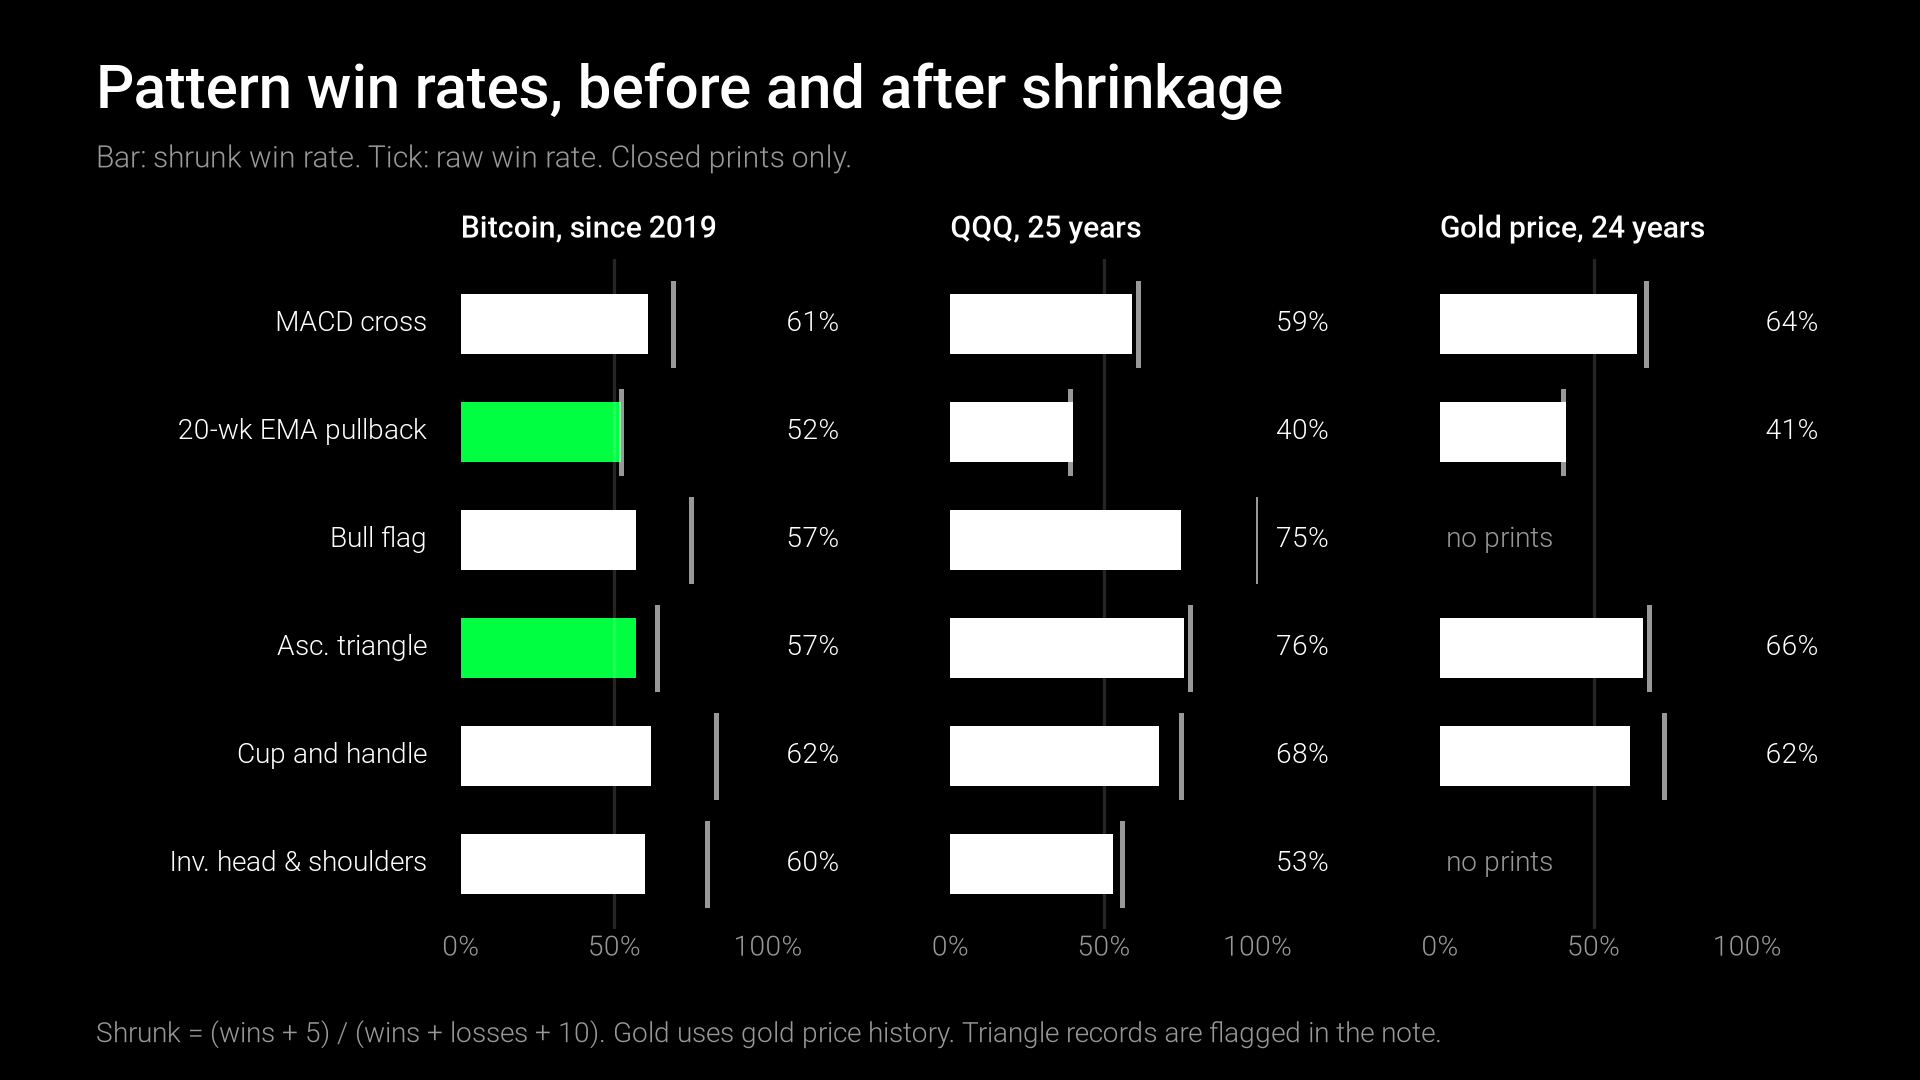
What shrinkage means. A pattern that worked 7 times out of 11 looks like a 64% hit rate, but 11 tries is a small sample. So before we trust a record, we add five imaginary wins and five imaginary losses: (wins + 5) / (wins + losses + 10). Short records get pulled toward a coin flip. Long records barely move. QQQ's 88-print triangle record shrinks from 78% to 76%; bitcoin's 11-print record shrinks from 64% to 57%.
Bitcoin: 85
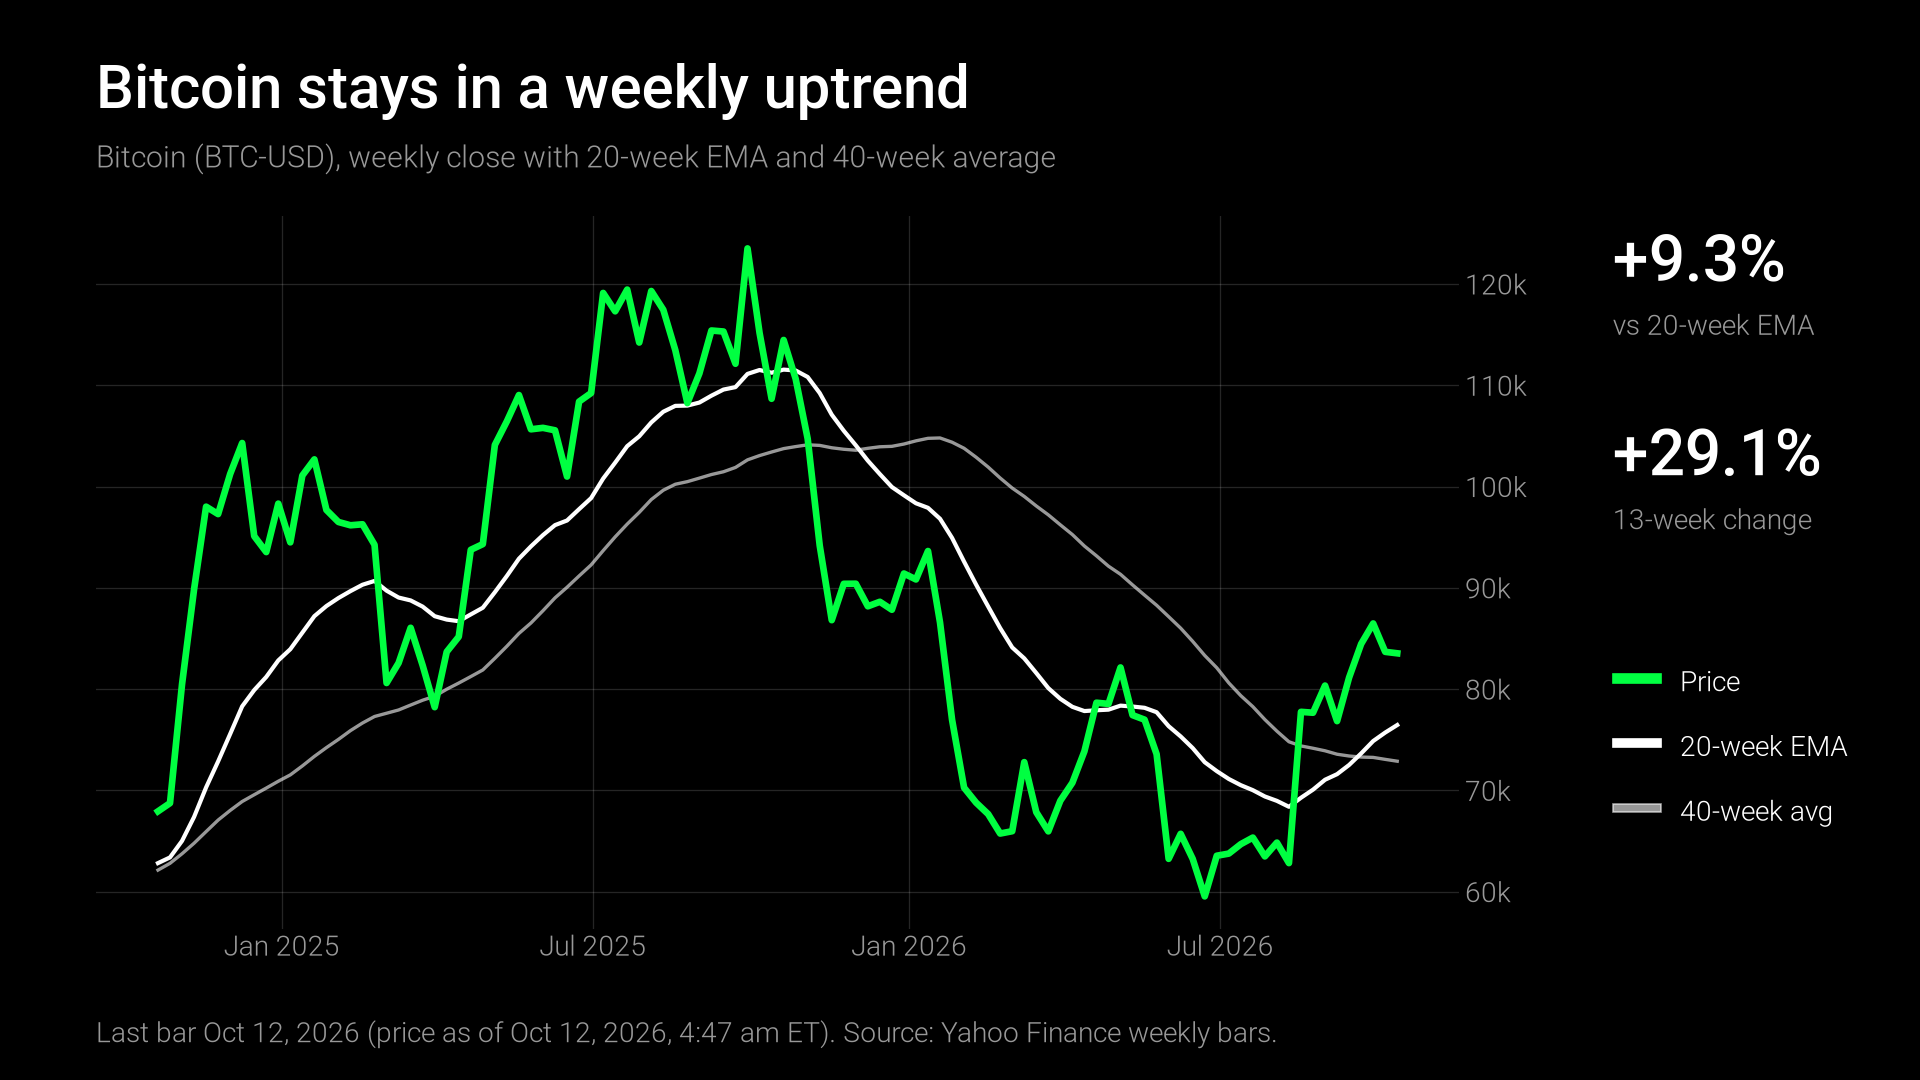
- Trend, 40 of 40. The price is above a rising 20-week EMA, the EMA is above the 40-week average, and the price is above the 200-week average.
- Momentum, 25 of 25. MACD is above its signal line and above zero. Bitcoin is up 29.1% over 13 weeks.
- Open pattern, 20.0 of 35. Two patterns are live, both first flagged the week of Sep 27 and still active on Oct 11: an ascending triangle (7 wins, 4 losses, 57% after shrinkage) and a 20-week EMA pullback in an uptrend (12 wins, 11 losses, 52% after shrinkage). The triangle's record is the stronger, so it sets the points: 35 × 57% = 20.0.
- Worth knowing. Bitcoin sits 9.3% above its 20-week EMA. We flag anything more than 8% above as extended. That doesn't change the score, but stretched trends often pause or retest before moving on.
Sixhundred is pro-bitcoin for the long term and doesn't trade it. A score of 85 says bitcoin sits inside a healthy weekly trend.
Pattern record since 2019 (closed prints, 13-week horizon)
| Pattern | Wins | Losses | Raw | Shrunk |
|---|---|---|---|---|
| Weekly MACD bullish cross | 9 | 4 | 69% | 61% |
| 20-week EMA pullback in an uptrend | 12 | 11 | 52% | 52% |
| Weekly bull flag | 3 | 1 | 75% | 57% |
| Ascending triangle | 7 | 4 | 64% | 57% |
| Cup and handle | 5 | 1 | 83% | 62% |
| Inverse head and shoulders | 4 | 1 | 80% | 60% |
| All patterns | 40 | 22 | 65% |
Recent bitcoin prints
| Pattern | First flagged | Outcome | Return |
|---|---|---|---|
| 20-week EMA pullback | Sep 27, 2026 | open | −1.0% so far |
| Ascending triangle | Sep 27, 2026 | open | −1.0% so far |
| Weekly MACD bullish cross | Jul 26, 2026 | win | +10.0% |
| Weekly MACD bullish cross | Apr 19, 2026 | win | +10.0% |
| 20-week EMA pullback | Oct 12, 2025 | loss | −3.2% |
| Weekly bull flag | Oct 5, 2025 | loss | −13.2% |
| Ascending triangle | Oct 5, 2025 | loss | −26.0% |
| Cup and handle | Sep 7, 2025 | win | +10.0% |
QQQ: 65
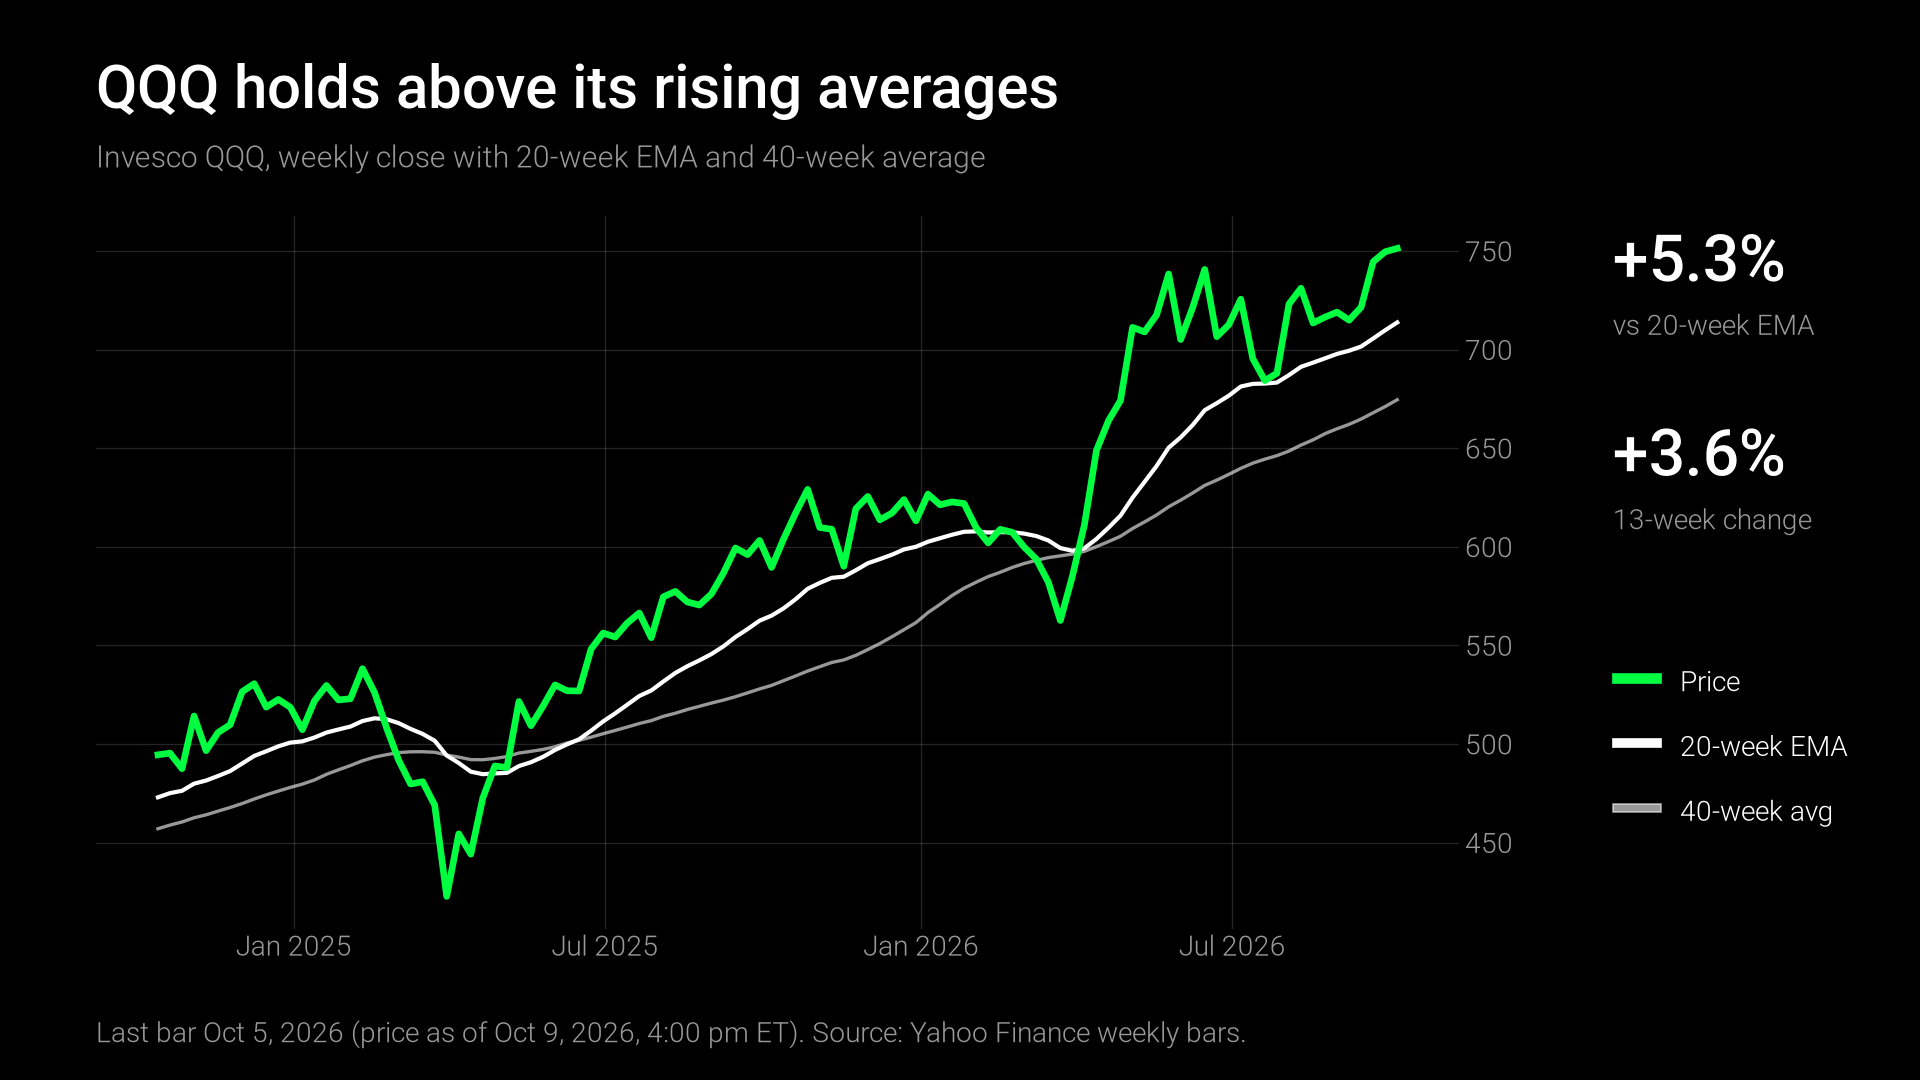
- Trend, 40 of 40. Every check passes. QQQ is 5.3% above its 20-week EMA, so it is in a clean trend without being stretched.
- Momentum, 25 of 25. MACD is above its signal line and above zero, and QQQ is up 3.6% over 13 weeks.
- Open pattern, 0 of 35. Nothing is live. The Aug 7 ascending triangle reached its recorded target in the week of Sep 21, and the Jun 12 cup and handle ran past its 13-week window in September. Both are closed, so QQQ scores on trend and momentum alone.
Pattern record over 25 years (292 prints: 177 wins, 113 losses, 61%)
| Pattern | Wins | Losses | Raw | Shrunk |
|---|---|---|---|---|
| Weekly MACD bullish cross | 31 | 20 | 61% | 59% |
| 20-week EMA pullback in an uptrend | 41 | 63 | 39% | 40% |
| Weekly bull flag | 10 | 0 | 100% | 75% |
| Ascending triangle | 69 | 19 | 78% | 76% |
| Cup and handle | 21 | 7 | 75% | 68% |
| Inverse head and shoulders | 5 | 4 | 56% | 53% |
Recent QQQ prints
| Pattern | First flagged | Outcome | Return |
|---|---|---|---|
| Ascending triangle | Aug 7, 2026 | reached target (week of Sep 21) | +2.6% |
| Cup and handle | Jun 12, 2026 | 13-week window ended in September | not yet scored |
| Ascending triangle | May 29, 2026 | loss | −3.0% |
| Weekly MACD bullish cross | Apr 24, 2026 | win | +10.0% |
| Cup and handle | Apr 17, 2026 | win | +10.0% |
| Ascending triangle | Dec 12, 2025 | win | +2.5% |
Gold: 20
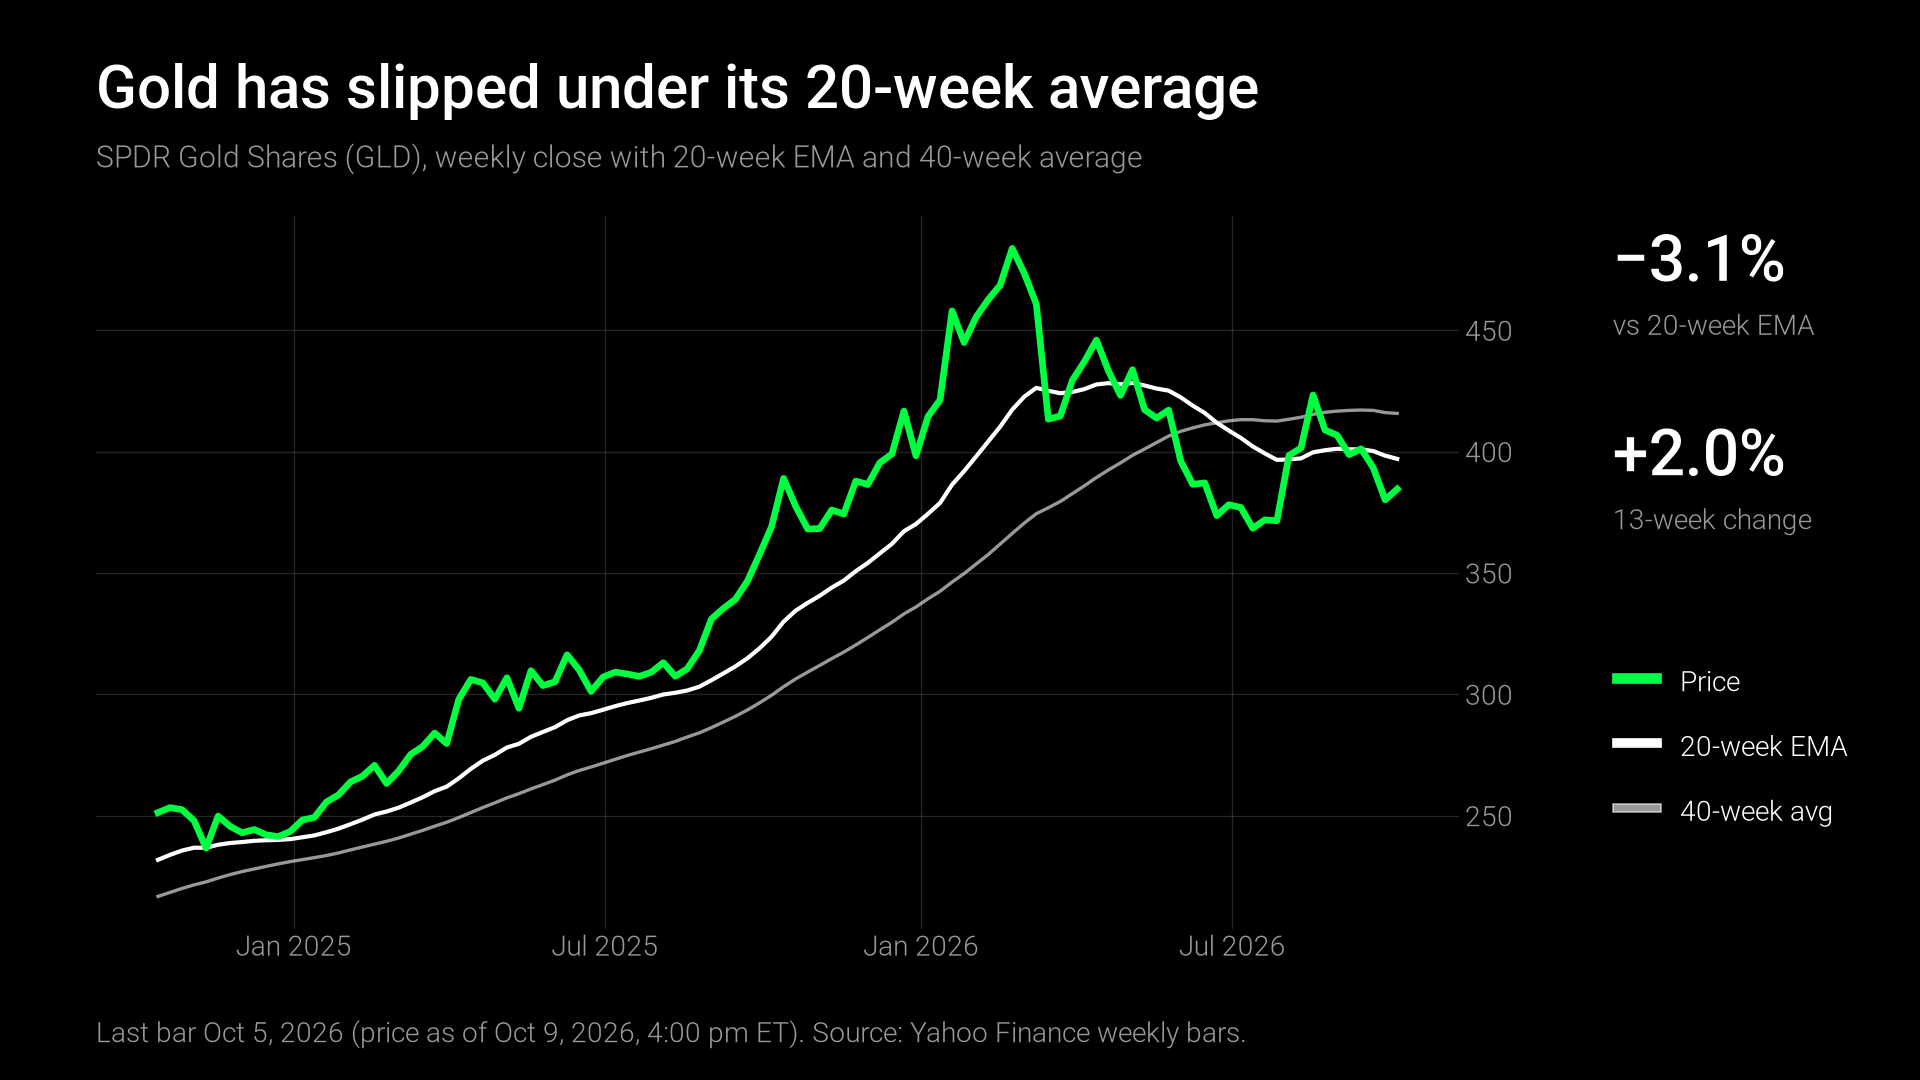
We score SPDR Gold Shares (GLD) on its own weekly closes. The pattern record comes from the gold price, which has a longer history.
- Trend, 10 of 40. GLD is 3.1% below its 20-week EMA, the EMA is falling and below the 40-week average. The one check that still passes is the long view: the price is well above the 200-week average.
- Momentum, 10 of 25. MACD is below its signal line and below zero. GLD is still up 2.0% over 13 weeks, which keeps 10 points.
- Open pattern, 0 of 35. The Aug 21 MACD cross on the gold price has failed: the gold price closed the week of Sep 28 at $4,162, below the pattern's $4,254 stop. Nothing else is live.
Pattern record on the gold price over 24 years (241 prints: 135 wins, 105 losses, 56%)
| Pattern | Wins | Losses | Raw | Shrunk |
|---|---|---|---|---|
| Weekly MACD bullish cross | 33 | 16 | 67% | 64% |
| 20-week EMA pullback in an uptrend | 41 | 61 | 40% | 41% |
| Ascending triangle | 53 | 25 | 68% | 66% |
| Cup and handle | 8 | 3 | 73% | 62% |
Recent gold price prints
| Pattern | First flagged | Outcome | Return |
|---|---|---|---|
| Weekly MACD bullish cross | Aug 21, 2026 | failed (closed under its stop, week of Sep 28) | not yet scored |
| Weekly MACD bullish cross | Sep 12, 2025 | win | +10.0% |
| Weekly MACD bullish cross | Jan 31, 2025 | win | +10.0% |
| Weekly MACD bullish cross | Aug 16, 2024 | win | +10.0% |
| Weekly MACD bullish cross | Mar 1, 2024 | win | +10.0% |
Notes on the data
- Rules behind the record. Each print is judged over 13 weeks: a win at the target, a loss at the stop, otherwise by the sign of the return when the 13 weeks are up. The default target is +10% and the default stop is −8%.
- Ascending triangle stops are not shown this week. Because no stop was applied, some triangle losses ran deeper than −8% (bitcoin's worst was −43.1%), and the triangle win rates are less reliable than the others. We will rescore them once the stop is recomputed.
- Recent outcomes. The QQQ and gold outcomes since early September are read from weekly highs, lows and closes. They will be confirmed in a future update.
- Sources. Sixhundred research; price data from Yahoo Finance.
- Score weights. The 40/25/35 split is a design choice. It hasn't been backtested as a score yet.
Technical research for readers. Not investment advice.